import functools
import math
from typing import Any, Generic, Literal, Protocol, TypeVar
from matplotlib.animation import FuncAnimation
from matplotlib.axes import Axes
from matplotlib.lines import Line2D
import numpy as np
import matplotlib.pyplot as plt
from matplotlib.projections.polar import PolarAxes
from numpy.typing import NDArray

FloatArray = NDArray[np.float64]
FloatArraySequenceHeight = TypeVar("FloatArraySequenceHeight", bound=int)
FloatArraySequenceWidth = TypeVar("FloatArraySequenceWidth", bound=int)
FloatArraySequence = np.ndarray[
    tuple[FloatArraySequenceHeight, FloatArraySequenceWidth], np.dtype[np.float64]
]
Kind = Literal["series", "sequence"]


class SeriesGenerator(Protocol):
    def __call__(self, theta: FloatArray, index: int) -> FloatArray: ...


class SeriesPlotter(Generic[FloatArraySequenceHeight, FloatArraySequenceWidth]):
    """

    :ivar width: Precision of sequence (number of terms). The second parameter of the generic should match this.
    :ivar height: Number of points in the input space. The first parameter of the generic should match this.
    """

    height: int
    width: int
    func: SeriesGenerator
    theta: FloatArray
    sequence: FloatArraySequence[FloatArraySequenceHeight, FloatArraySequenceWidth]
    series: FloatArraySequence[FloatArraySequenceHeight, FloatArraySequenceWidth]

    def __init__(
        self,
        func: SeriesGenerator,
        *,
        height: FloatArraySequenceHeight,
        width: FloatArraySequenceWidth,
        theta: FloatArray | None = None,
    ):

        self.func = func
        self.height = height
        self.width = width

        self.theta = theta or np.linspace(0, 2 * math.pi, self.height)
        self.sequence = self.create_series_sequence()
        self.series = self.create_series()

    def create_series_sequence(
        self,
    ) -> FloatArraySequence[FloatArraySequenceHeight, FloatArraySequenceWidth]:
        """
        Given a series whose members are the sequence `a_n`, return
        `{a_k: where k is positive and less than 'series_length'}`

        `create_series` can be used to sum these elements together.
        """

        return np.array([self.func(self.theta, index) for index in range(self.width)])

    def create_series(
        self,
    ) -> FloatArraySequence[FloatArraySequenceHeight, FloatArraySequenceWidth]:
        return np.array([sum(self.sequence[: k + 1]) for k in range(0, self.width)])

    def create_subplots(
        self,
        rows: int,
        cols: int,
        *,
        kind: Kind = "series",
        subplot_kw: dict[str, Any] = {"projection": "polar"},
    ):
        """Put series or sequences into (polar) subplots."""

        coords = self.sequence if kind == "sequence" else self.series
        fig, axs = plt.subplots(rows, cols, subplot_kw=subplot_kw)
        positions = (
            (k, k // cols, k % cols) for k in range(rows * cols) if k < self.width
        )

        ax: PolarAxes
        for k, row, column in positions:
            ax = axs[row][column]
            ax.plot(self.theta, coords[k], linewidth=0.8)

        return fig

    def frame_animation_rect(
        self, axes: Axes, line: Line2D, frame: int, *, coords
    ) -> tuple:
        """Animated a single frame."""

        frame_f = coords[frame]
        line.set_ydata(frame_f)
        line.set_label(f"n = {frame + 1}")
        axes.legend(handles=[line])

        return (line,)  # if callback is None else callback(line)

    def create_animation_rect(self, kind: Kind = "series"):
        """
        Create an animation of the series or sequence in increasing precision
        in rectilinear coordinates.
        """

        coords = self.series if kind == "series" else self.sequence
        frames = list(range(self.width))

        axs: Axes
        fig, axs = plt.subplots(1, 1)
        axs.set_title("Sawtooth Wave Foureir Series")

        (line,) = axs.plot(self.theta, self.series[0])
        line.set_label("n = 1")
        axs.legend(handles=[line])

        fn = functools.partial(self.frame_animation_rect, axs, line, coords=coords)
        return FuncAnimation(fig, fn, frames=frames, interval=333)

    def create_animation(self):
        """Plot series or sequence members in polar coordinates."""
...About NumPY Type Hints
numpy, python, fourier series, polar coordinates, quarto, neoim, multen, pandas, data science
I wrote this up while learning how to use molten-nvim. I kept on writing and eventually found more that I wanted to write about type hints in numpy because good type hints make writing code in python a pleasure and not a chore.
If you are curious about using using neovim for data-science and python notebooks, checkout the neovim gallery and repository here on the site:
About Type Hints for Numpy Arrays
What I have ascertained so far is:
- PEP 646 proposed
TypeVarTupleand was accepted inpython3.11. This makes it possible to parametrize a type using an arbitrary number of parameters. - PEP 646 is supported by
mypy. - PR #17719 on numpy adds shape parametrization to
np.ndarray. - Type hints for
NDArrayare still not complete or practical, see this comment. - Type hints for
NDArrayare not going be checked bypyright, which is the type checker I like to run in myquartonotebooks.
With that out of the way, I would like to say that the type hints in the following code are mostly for my own experimentation and are possibly incorrect. The objective is to have SeriesPlotter have correct type hints for the attributes sequence and series, which should include the size of the numpy arrays.
To do this, SeriesPlotter is a generic of two parameters - the first specifies the number of points in the input space and the second specifies the number of elements in the series.
An Example Using The Type Hints
The objective of the code in Figure 1 is to plot some graphs of series using normal and polar coordinates (via matplotlib) with type hints.
numpy array in terms of height and width. This requires that every instance of SeriesPlotter specifies the height (number of points in the domain) and width (number of sequence members computed) to specify the shape of the numpy array stored in the series and sequence attributes. For example, the code code in Figure 2 will generate a \(1000 X 8\) array - the first \(8\) sequence members will be computed on a \(1000\) point domain.
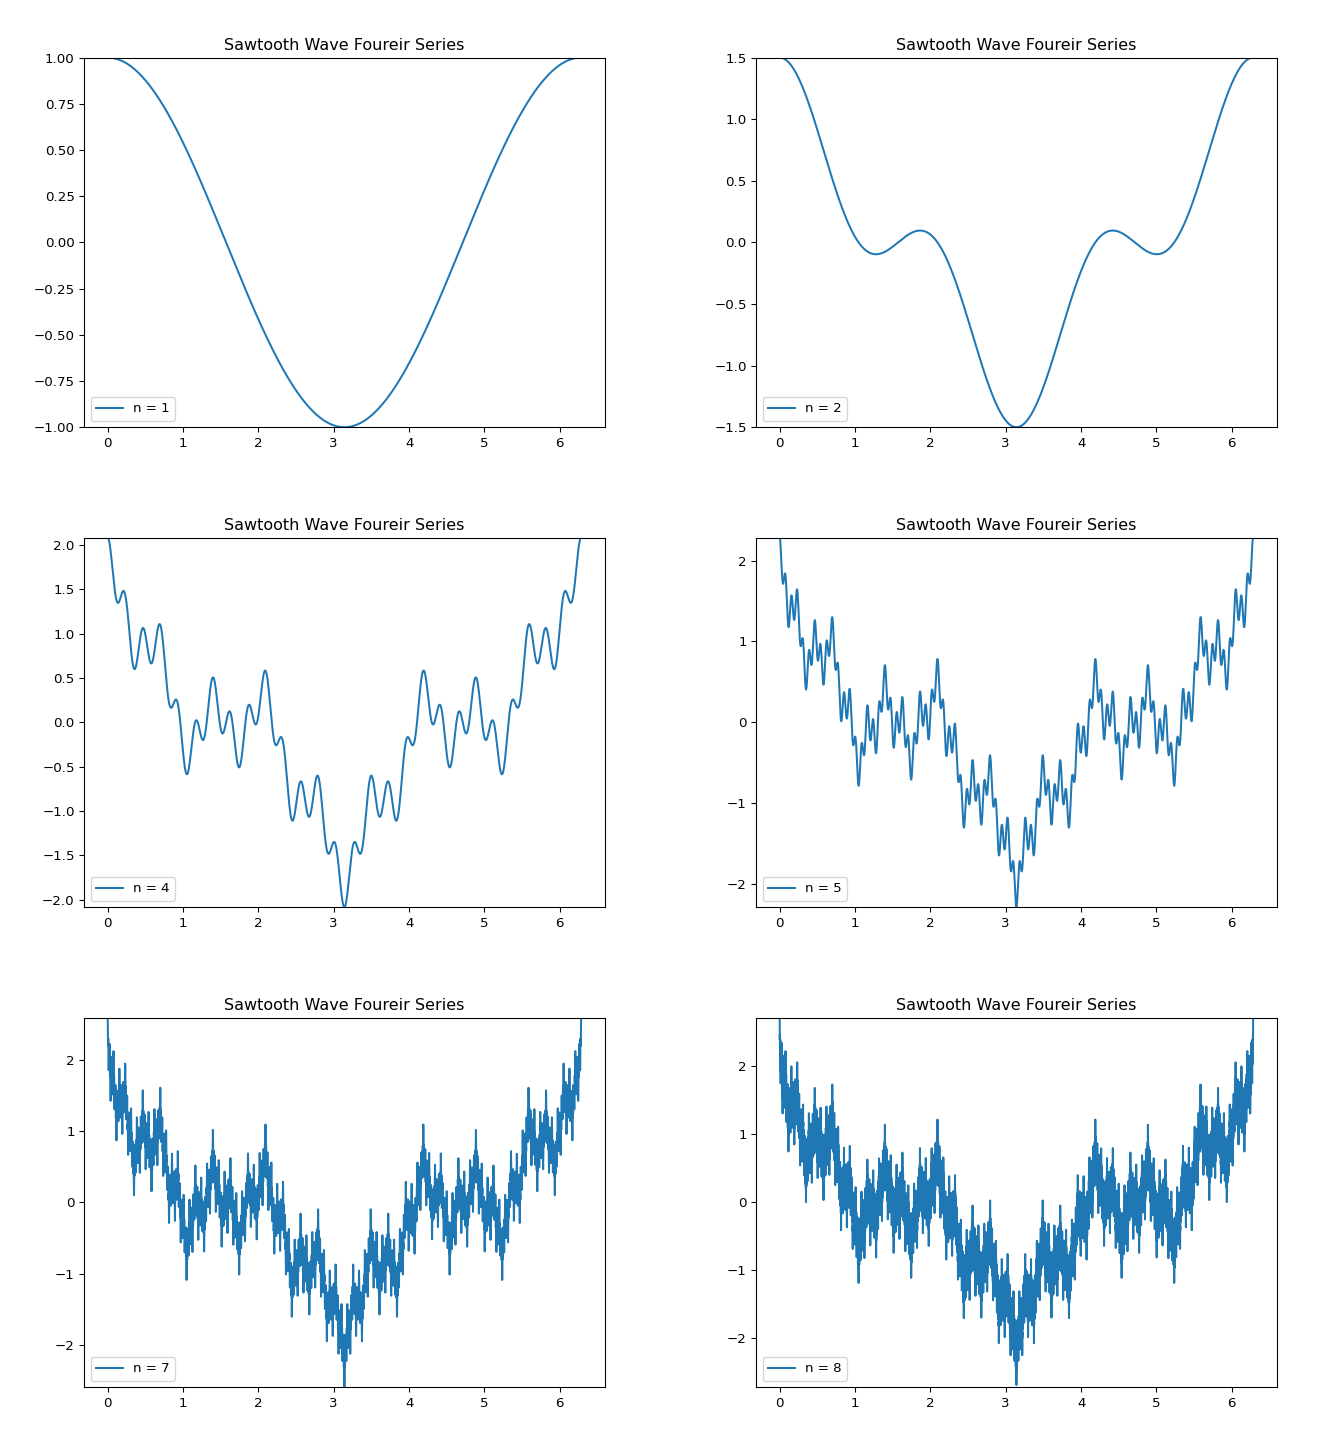
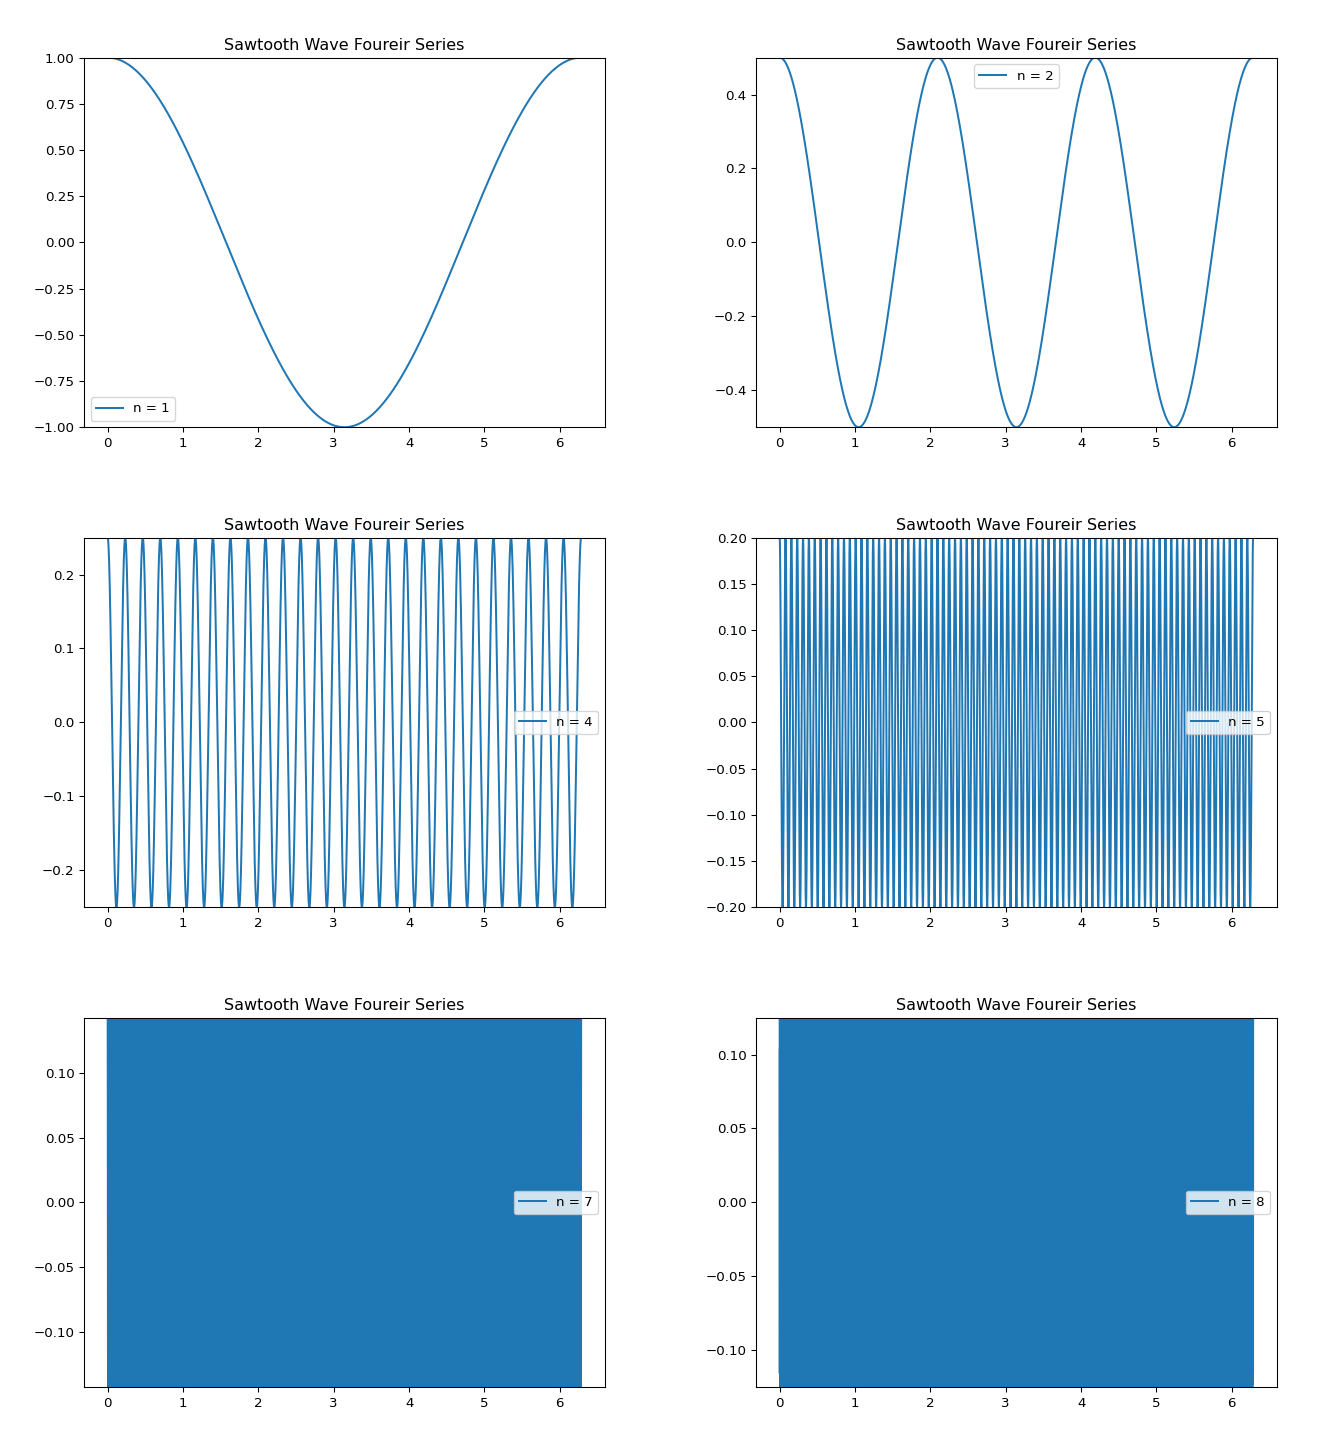
Maple Leaf Like Cardioid
class LeafyPlotter(SeriesPlotter[FloatArraySequenceHeight, FloatArraySequenceWidth]):
    @staticmethod
    def fn(theta: FloatArray, index: int) -> FloatArray:
        return np.cos(theta * (3**index)) / (index + 1)

    def frame_animation_rect(
        self, axes: Axes, line: Line2D, frame: int, *, coords
    ) -> tuple:
        bound = max(
            abs(min(coords[frame])),
            abs(max(coords[frame])),
        )
        axes.set_ylim(-bound, bound)

        return super().frame_animation_rect(axes, line, frame, coords=coords)

    def __init__(
        self,
        *,
        height: FloatArraySequenceHeight,
        width: FloatArraySequenceWidth,
        theta: FloatArray | None = None
    ):
        super().__init__(self.fn, height=height, width=width, theta=theta)


leafy_plotter = LeafyPlotter[Literal[10000], Literal[8]](height=10000, width=8)
leafy_figure = leafy_plotter.create_subplots(2, 2, kind="series")
leafy_figure.savefig("./leafy.svg", format="svg")
plt.close()

leafy_figure_sequence = leafy_plotter.create_subplots(2, 2, kind="sequence")
leafy_figure_sequence.savefig("./leafy-sequence.svg")
plt.close()

leafy_animation = leafy_plotter.create_animation_rect()
leafy_animation.save("leafy-rectilinear.gif", writer="pillow")
plt.close()

leafy_animation = leafy_plotter.create_animation_rect(kind="sequence")
leafy_animation.save("leafy-rectilinear-sequence.gif", writer="pillow")
plt.close()

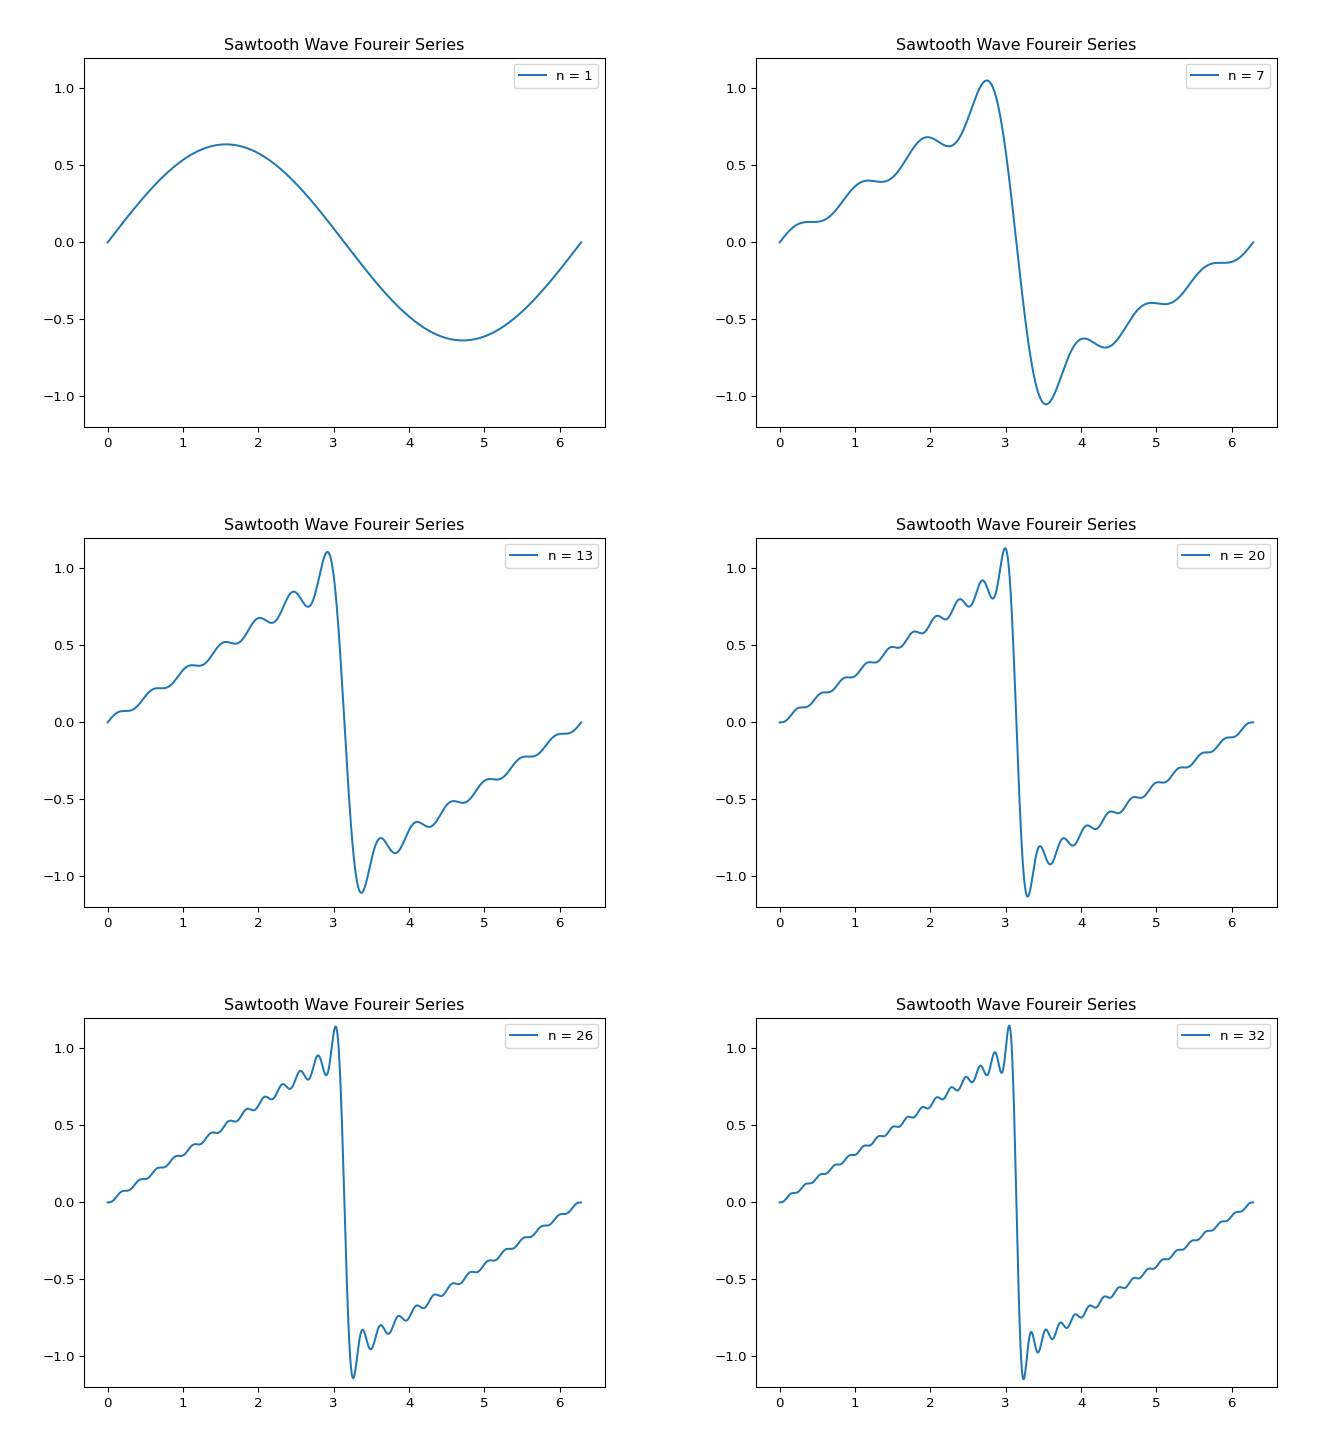
The Sawtooth Cardioid
Next I wanted to plot a sawtooth wave using a Fourier series,
class SawtoothPlotter(SeriesPlotter[FloatArraySequenceHeight, FloatArraySequenceWidth]):
    @staticmethod
    def fn(theta: FloatArray, index: int) -> FloatArray:
        """Computes the term `a_{index}` of the Fourier series for the sawtooth wave."""

        if index < 0:
            raise ValueError

        index += 1
        constant = (1 if index % 2 else -1) / index
        constant *= 2 / np.pi

        return constant * np.sin(theta * index)

    def frame_animation_rect(
        self, axes: Axes, line: Line2D, frame: int, *, coords
    ) -> tuple:
        axes.set_ylim(-1.2, 1.2)
        return super().frame_animation_rect(axes, line, frame, coords=coords)

    def __init__(
        self,
        *,
        height: FloatArraySequenceHeight,
        width: FloatArraySequenceWidth,
        theta: FloatArray | None = None
    ):
        super().__init__(self.fn, height=height, width=width, theta=theta)


sawtooth_plotter = SawtoothPlotter[Literal[1440], Literal[32]](height=1440, width=32)
sawtooth_animation = sawtooth_plotter.create_animation_rect("series")
sawtooth_animation.save("sawtooth.gif")
plt.close()
MovieWriter ffmpeg unavailable; using Pillow instead.
Molten in Action
