import matplotlib.pyplot as plt
import numpy as np
import math
import pathlib

from matplotlib.animation import FuncAnimation


DIR = pathlib.Path(".").resolve()
SINE_FRAMES: int = 128


phis = np.arange(0, 2 * math.pi, step=2 * math.pi / SINE_FRAMES)
yys = np.sin(phis)
yys_shifted = np.empty_like(yys)


def update(frame: int):
    break_index = SINE_FRAMES - frame

    # NOTE: Yucky but efficient.
    head = yys[:break_index]
    tail = yys[break_index:]

    yys_shifted[:frame] = tail
    yys_shifted[frame:] = head

    line.set_ydata(yys_shifted)
    return (line,)


fig, ax = plt.subplots()
(line,) = ax.plot(phis, yys)
animation = FuncAnimation(fig, update, frames=SINE_FRAMES, interval=1)
animation.save(DIR / "sine.gif", writer="pillow")  # Save animation

plt.savefig(DIR / "thumb.png")  # Save for thumbnail
plt.close()Animations in Quarto Using Python
python, seaborn, numpy, diagram, matplotlib, animation, ffmpeg
This is an example of how to create animations with python in quarto notebooks using matplotlib. Having not used animations very much in matplotlib and not knowing much about quarto I figured I should write some notes for anybody else who has to deal with this in the future as I did not find it to be completely obvious.
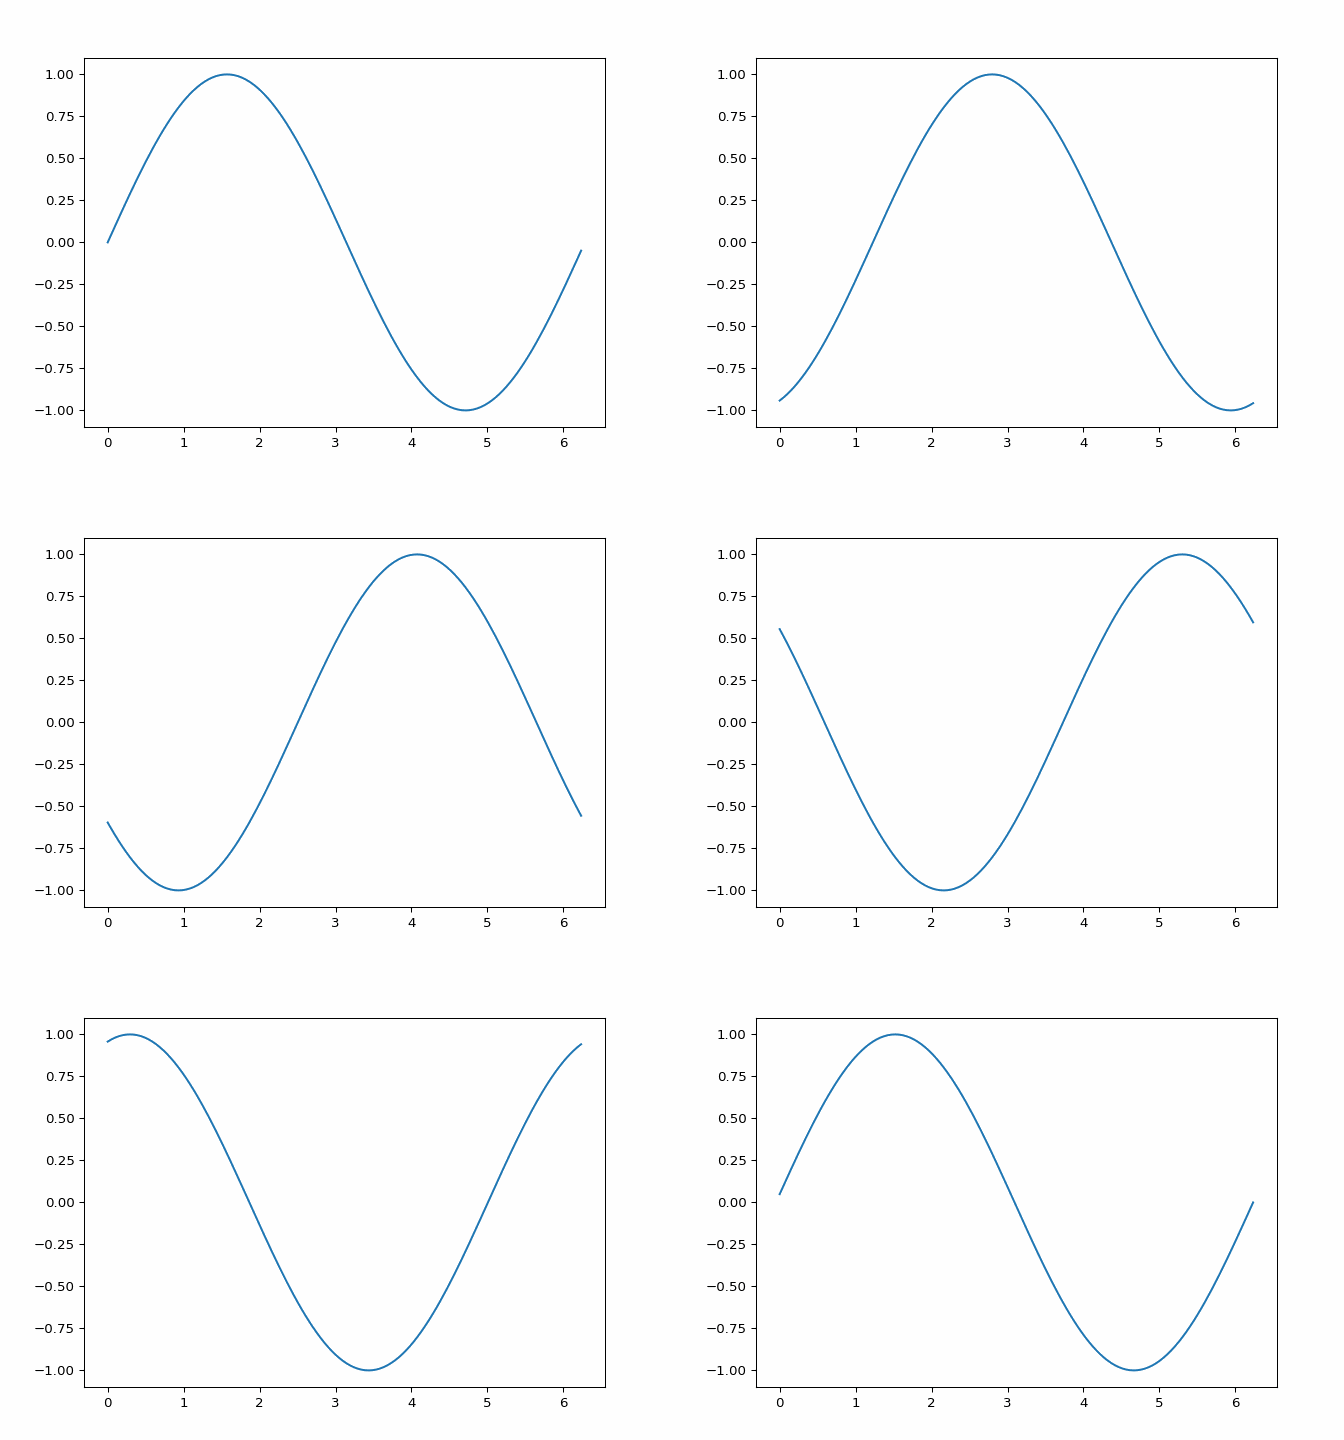
For this demonstration we will plot a sine wave with an increasing phase offset \(\phi\) over the interval \([0, \pi)\). More precisely, the graph animated is
\[\begin{equation} f\_\psi: \phi \mapsto sin(\phi + \psi) \end{equation}\]
for one \(\psi \in [0, \pi)\) and all \([0, \pi]\) on each frame.
The following code is used to export a gif of the sinusoid:
No figure is generated from this code, instead the figure is included from the saved gif as follows:
which is used to include the following figure:

gifThis could also by done by using
from IPython.display import HTML

plt.close()
HTML(animation.to_jshtml())
however I have found this to be quite slow when developing and has some relative downsides such as a slower render time, difficulty in conditional rendering, and a slower load time. More is said in the next section.
Advantages of Exporting
It is important to note that this figure could be directly embedded within the webpage. However this results in the webpage being quite large - this can be a problem when using a quarto website as it
- Results in a longer load-time.
- Makes it difficult to open when inspecting
HTMLoutput directly. - Some websites will not craw if the page is too large.
In my case linkedin would not create a preview card for my link, complaining that my document was too large. A version of my post about the logistic map reached a horrific size of about 11M. There are a number of ways the size can be determined - in my case I used wget localhost:3000/posts/logistic and got the following output:
--2024-08-06 12:29:38--  http://localhost:3000/posts/logistic
Resolving localhost (localhost)... 127.0.0.1
Connecting to localhost (localhost)|127.0.0.1|:3000... connected.
HTTP request sent, awaiting response... 301 Moved Permanently
Location: /posts/logistic/ [following]
--2024-08-06 12:29:38--  http://localhost:3000/posts/logistic/
Connecting to localhost (localhost)|127.0.0.1|:3000... connected.
HTTP request sent, awaiting response... 200 OK
Length: 12015385 (11M) [text/html]
Saving to: ‘logistic’
Switching to gif output, the size of the webpage is now drastically reduced:
--2024-08-06 13:13:44--  http://localhost:3000/posts/logistic
Resolving localhost (localhost)... 127.0.0.1
Connecting to localhost (localhost)|127.0.0.1|:3000... connected.
HTTP request sent, awaiting response... 301 Moved Permanently
Location: /posts/logistic/ [following]
--2024-08-06 13:13:44--  http://localhost:3000/posts/logistic/
Connecting to localhost (localhost)|127.0.0.1|:3000... connected.
HTTP request sent, awaiting response... 200 OK
Length: 96239 (94K) [text/html]
Saving to: ‘logistic.1’